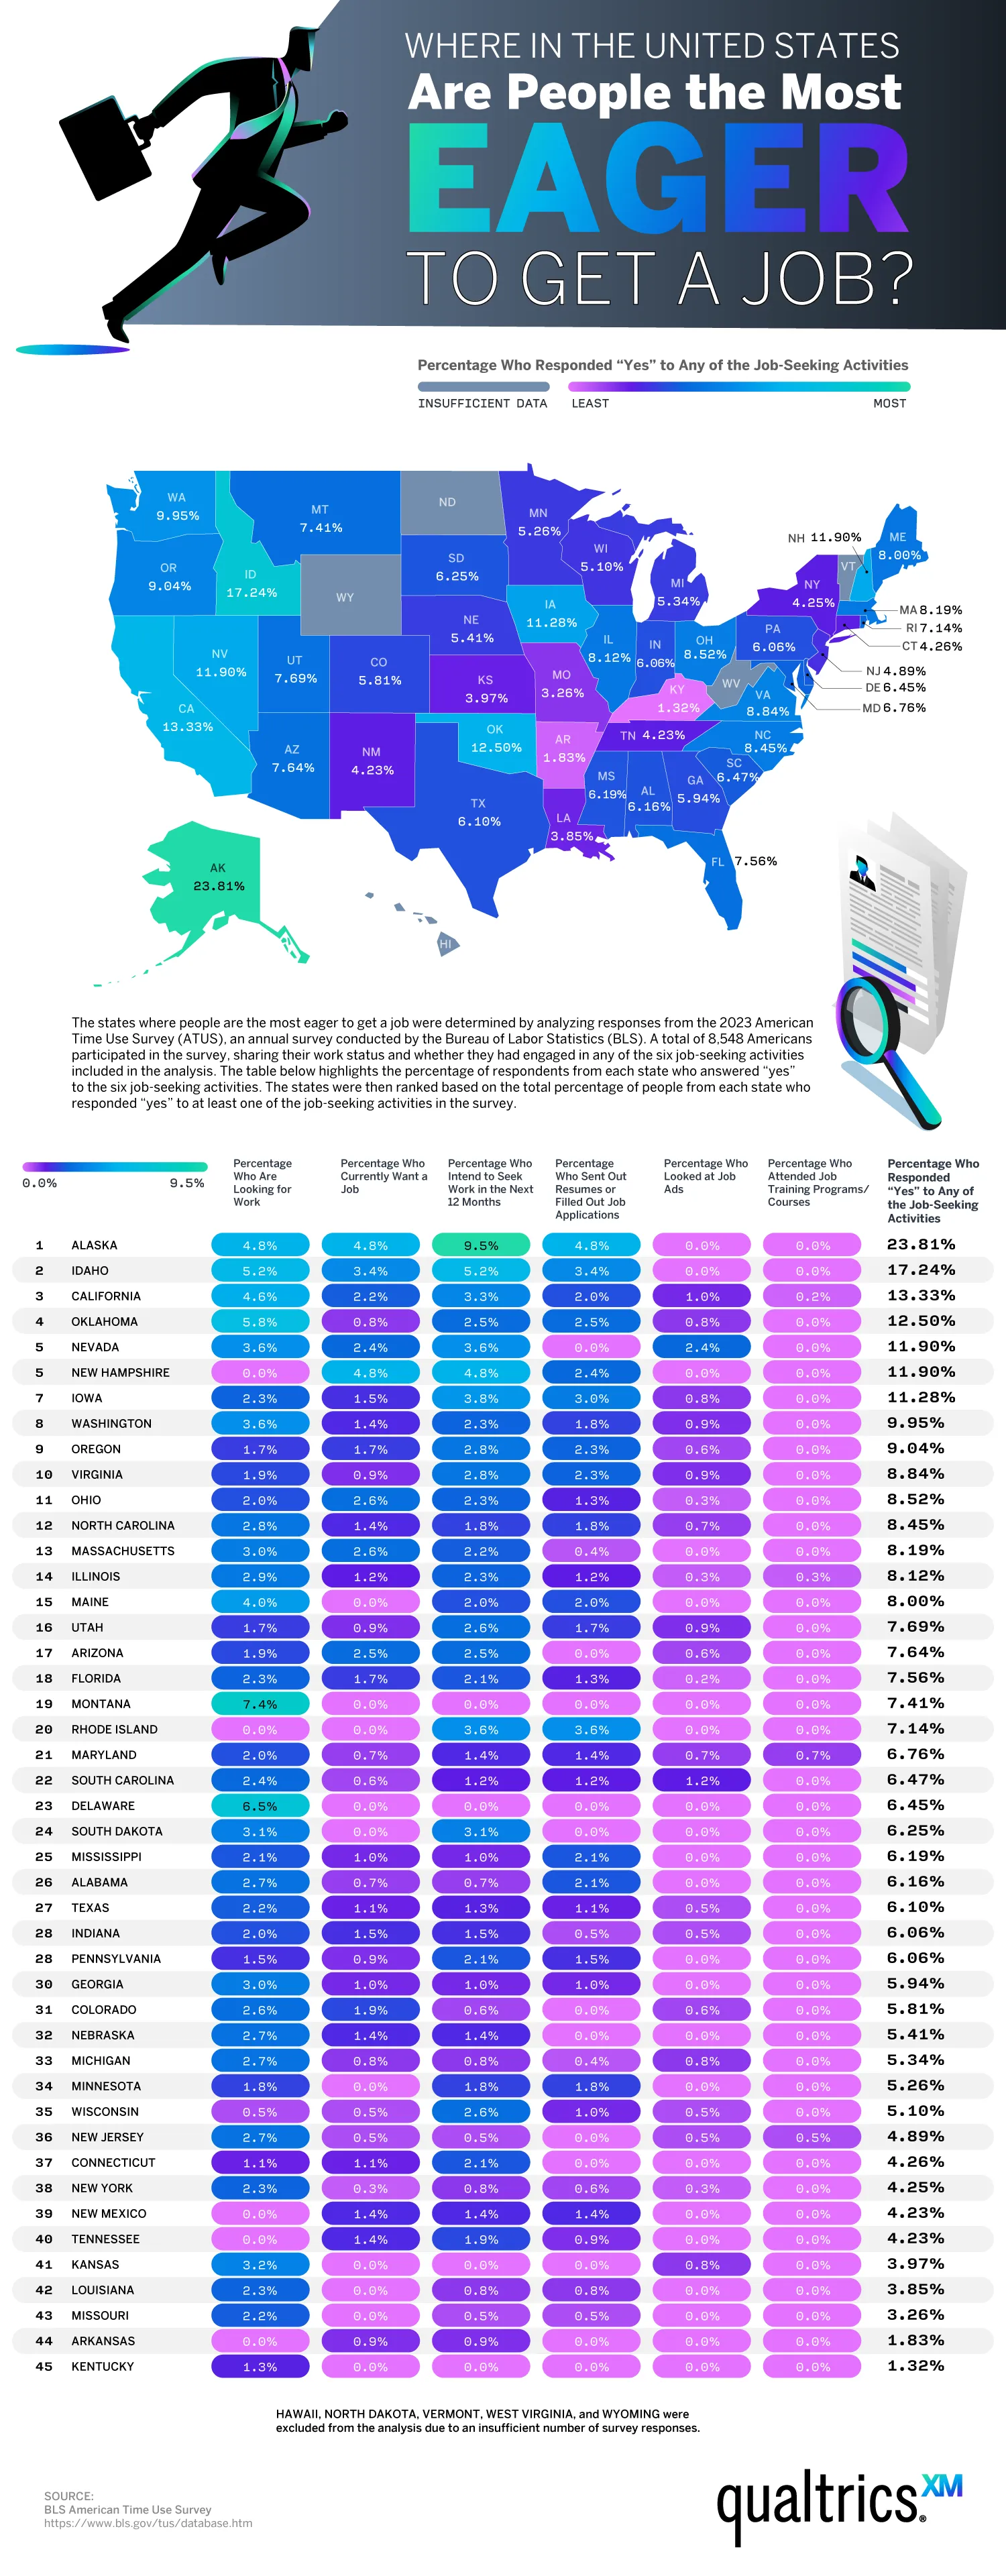
A map from Qualtrics visualizes regional labor market patterns by showing job-seeking activity rates. They used Bureau of Labor Statistics data to show where workforces have the most mobility. They drew on data from a 2023 survey with 8,548 respondents. They measured six types of job-seeking activity and ranked the states accordingly:
• Alaska: 23.81%
• Idaho: 17.24%
• California: 13.33%
• Nevada: 12.50%
• New Hampshire: 11.90%
• Iowa: 11.90%
• Washington: 11.28%
• Oregon: 9.04%
• Virginia: 8.84%
Frontier states with a growing economy top the list here. We see Alaska, Idaho, Nevada, and Washington rank among the top ten for active labor reallocations in states experiencing population booms and infrastructure development. California, in the third spot, ranks for a different reason. This large, prosperous state has many thriving industries, like tech and entertainment, that will always create job openings and attract hungry talent. Moving to the bottom of the rankings, we find Kentucky, Missouri, and Arkansas, which have lower workforce churn and/or tight labor markets.
Sometimes job-seeking activity is a marker of job satisfaction. According to the team’s data, 42% of employees feel engaged at work, a shockingly low number. 62% feel leaders at work don’t listen to their employees’ feedback. These feelings can lead workers to switch jobs multiple times. In high-activity states, managers should examine their employee retention rates. This data can help HR managers assess their strategies. An active job-seeking region can be an opportunity for businesses and potential employees alike.
States with expanding economies and robust industries experience higher workforce churn, reflecting dynamic labor markets and growth opportunities. Meanwhile, regions with less turnover often maintain tighter labor markets, signaling stability. Overall, these patterns highlight the significance of economic development and industry diversification in shaping labor mobility across the nation.